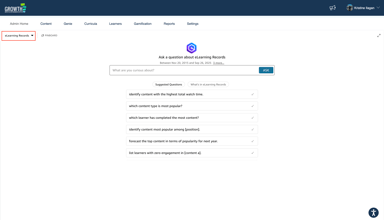
AI Insights Reporting is a generative Q&A feature that makes reporting more intuitive and accessible. It allows admins to ask questions about your LMS data in plain English and instantly receive insights—whether as tables, charts, or forecasts—without needing to build reports manually.
Start with the video overview, then dive deeper with the guide below.
Your LMS data is organised into topics.
The eLearning records topic includes:
- Users who haven’t started eLearning (previously unavailable in LMS reporting)
- Completion data, session duration, scores, visits, and statuses for eLearning content users have access to
- Records from SCORM-based eLearning, quests, and video modules
The eLearning reviews topic includes:
- Feedback collected after a learner completes an eLearning module
- A numerical rating (1–5) reflecting overall satisfaction
- Optional free-text comments that may include praise, suggestions, or constructive criticism
The Logins topic includes:
-
Records of learner login activity in the LMS
-
Insights into frequency and recency of logins
The Knowledge Contests topic includes:
-
Records of knowledge contest (battle) participation
-
Contest details such as start date, title, description, and status
-
User roles (challenger and opponent), scores, and completion times
-
Outcomes including win, lose, draw, or pending status
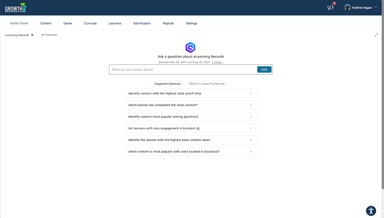
You have the ability to switch between different data topics directly from the top-left of the Q&A screen.
Future topics will cover areas such as Social and Events data.
👷 Accessing the AI Insights Reporting
-
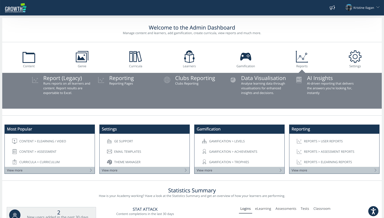
Log in to your LMS and navigate to the Admin Dashboard (or Admin Home)
-
Click on “Reports”, then select “AI Insights”.
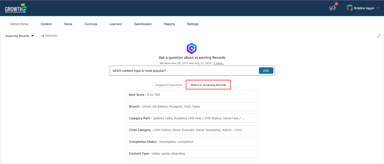
🛠️ Working with Your Insights
When using AI Insights, keep your questions simple, direct, and concise. You can start with the suggested sample questions or write your own, but always try to reference specific field names to get more accurate results.
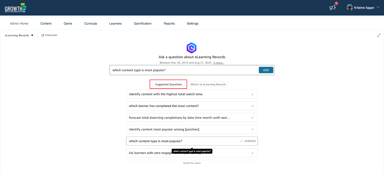
If you’re unsure what to ask, review the fields available in the topic to guide your queries.
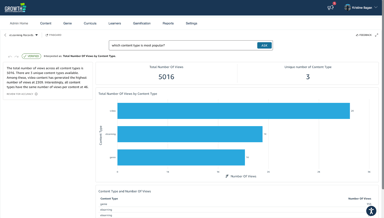
When you receive a response, each visual allows you to:
- Explore insights and forecasts (where applicable)
- Change the visual type
- Export the data
- Add visuals to a Pinboard for quick access later (via the “Pinboard” option on the Q&A homepage)
🙌 That's It!
AI Insights Reporting makes it easier to turn learning data into meaningful insights. By simply asking questions in natural language, you can generate reports and visuals that highlight progress, engagement, and areas for improvement. Use these insights to make data-driven decisions and continuously enhance your learning programs.